
Hello! Sorry for a ten month hiatus. Anything exciting happen since I’ve been gone?
I’ve wanted to do some type of political post for a while but never knew how to wade in. You probably get bombarded as is with political tweets, videos, and articles. I don’t think a blog post of me espousing my opinions is really what anyone needs in these trying times. So I found a compromise. I put together a small data project / experiment to evaluate the 2020 election, primarily to compare with other major models and the polls as a whole. Which brings me to the true purpose of this project, to understand if the polls really can be trusted after the infamous inaccuracies of 2016. The short answer – with enough of a cushion built in, yes.
Before we get into it, if you were to leave right now and not read anything further, check out this awesome site: 270toWin. You can play around with electoral vote scenarios, look at different projected outcomes, and even explore past elections.
THE U.S. ELECTORAL COLLEGE
This is mostly for non-American friends, but also maybe a good refresher for those of us who didn’t do so well in high school government (me).
There are a total of 538 electoral votes and to win the US presidential election you need at least 270. It is theoretically possible for a 269 – 269 tie. Each state has a set number of electoral votes decided by state population, which is informed by the US census conducted every ten years. The actual formula for electoral votes per state is: number of senators (always 2 per state) + number of representatives (which on average is 1 per 711,000 citizens). DC gets three votes as well. Puerto Rico and other territories get none. Electoral votes per state can be seen below (from Wikipedia).
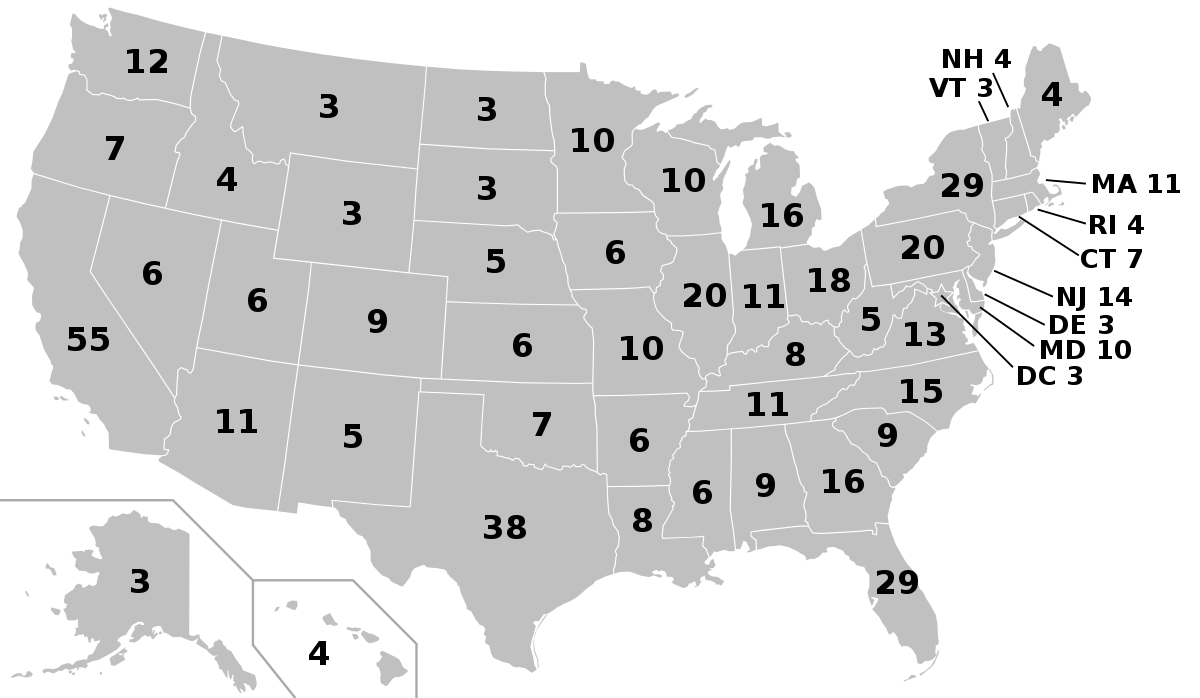
The popular vote of each state is tallied, and the winner of each state takes all the electoral votes of that state. If I were to win Florida by one vote compared to my opponent, I get all 29 electoral votes and they get zero. There are rare cases where this does not happen, but we will ignore that moving forward for simplicity’s sake. Also worth noting that Nebraska and Maine have a hybrid system where they break their votes up into smaller districts, which each getting one electoral vote. The remaining two electoral votes per state that are not decided by the districts are awarded to the overall winner of the total state popular vote. So it is possible to split the electoral votes of either of these two states.
This system seems a bit ridiculous and overly complicated today, but it was all intended to give some balanced distribution between small and large states, and to encourage candidates not to ignore any particular region of the country.
Due to this structure, we do not have an actual national popular vote. In 2016 and 2000, Trump and Bush both won the election by electoral votes but lost the national popular vote. Discussion of disbanding the electoral college is always a hot topic, but not one I plan on covering here.
PRIMER ON POLLS AND ELECTION MODELS
Polls come in from all over and can be conducted by many parties: research groups, news networks, universities. They can vary in size, method, and in quality. Hell, I could probably send a SurveyMonkey link out from this blog and conduct my own poll. Due to the variance in some of these factors, individual polls are really not worth paying attention to. Aggregating them however yields much better results. Any reputable news source does this, and the best give extra credit to higher quality polls, or better yet, don’t even accept questionable polls. If you ever read an article that claims “Polls are saying Candidate A is up 7 points…” and they cite one obscure poll, laugh, and move along.
Two particularly good poll aggregators are FiveThirtyEight and The New York Times.
Once we have good polling averages, we can start to do some cool things with election modeling. Using sterilized aggregated state polls, a model can simulate many elections in many states and piece together all possible outcomes. Advanced models take into account some really nifty factors, such as correlation between state (if one state votes a certain way, a similar state may as well – such as Michigan and Ohio) and projected voter turnout and demographics.
My favorite model, and statistics driven journalism outlet as a whole, is FiveThirtyEight. See their model here. They have Biden winning in 89/100 simulations. Another great one is the Economist, who just rolled out their own model for the first time this election. Something really cool about their model is that they share all the source code. They see Biden up at 96/100. I think that’s a bit high.
WHAT THE HELL HAPPENED IN 2016?
In 2016 Hillary Clinton was favored to win the election, by a lot, and ultimately lost. This loss is so seared into the minds of many that the polls have taken a serious credibility hit. Interestingly enough, 2016 ‘s polling wasn’t that bad.
I will attempt to very briefly summarize some of the pitfalls of 2016. For a deeper dive, consider reading FiveThirtyEight’s 2018 article: The Polls Are All Right.
What is polling error?
“Error” (sometimes called “uncertainty”) is a common mathematical term and is used in many applications. Consider a science experiment where you have to take 10 measurements by hand. There is considerable uncertainty that will occur because you have 10 different cases which each have their own potential error within them. This error can be compounded through the measurements. If you are off +0.1 inches each time, it doesn’t seem like much, but after ten measurements you will record a full inch longer than is actually true. If all measurements are perfect, the final result will be perfect. If half the measurements are +0.1 inches off, and half are -0.1 inches off, you not once measured a single case correctly, but the total measurement will be perfectly accurate!
Polls are somewhat similar. You are sampling small groups of people and aiming to use those distributions to then apply to the full population. If the sample you have selected does not represent the whole, the results you have likely will not represent the whole as well.
A polling error, is the numeric distance between polled prediction and actual result. Example: Polls predict Candidate A will win +7%, and they end winning by +12%. That is a +5% error. In another scenario they win by a closer margin by +2%. That is a -5% error. In both scenarios there is a 5% error, albeit in different directions. If you know that the polling error is 5%, and a candidate is at +7%, realize that it is totally within the realm of possibility that the range of that candidate’s lead is, on average, really +2% to +12%.
We don’t ever really know the polling error, however, until the election is complete. There are complex statistical ways to estimate, but when balancing polls of various sources and credibility, quality of each poll really starts to make a difference on the accuracy of the error range.
The polling error of 2016 was higher than usual, but not extremely so.
See the graphic from FiveThirtyEight:
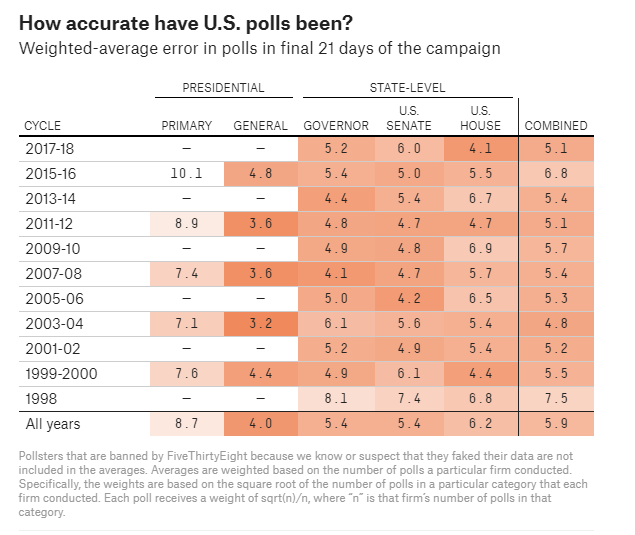
In 2016 the average polling error was 4.8% in the presidential election. There were a lot of close states and using this error we can see just how many states could have gone the other way. I put together a table showing actual vote margin, and then what the polls could have shown if we are assuming a uniform 4.8% error in either direction.
Note: I use negative (-) measurements for Democrats and positive (+) for Republicans for the rest of this post.
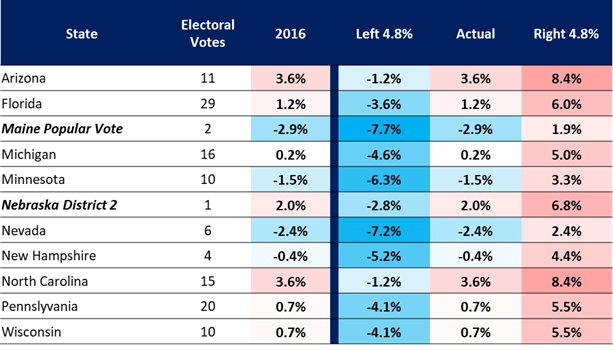
Historically, a lot of polling inaccuracy is overlooked. Consider if every case were like Nevada – Left 4.8%. A heavy lead was projected (-7.2%), and then the final result was -2.4%. It went to the party it was projected to anyways, so many do not pay attention to this flawed estimate. It seemed inconsequential, just a harmless error. Due to our winner take all system, winning by 0.001% is enough to take all the electoral votes.
Yet if Pennsylvania is projected at -4.1%, and flips to +0.7%, the Republicans now take the state. “How can the polls be so wrong!?”. “What a surprise!”. That scenario is much more consequential than the Nevada hypothetical we laid out above. People remember these events.
To summarize the 2016 election: Trump very narrowly won multiple swing states that the polling error had him just on the edge. It was improbable, but not impossible. Florida, Michigan, Pennsylvania, Wisconsin alone accounted for 75 electoral votes.
Average polling error doesn’t fully equal margin of error.
There was more at play than just the 4.8% average polling error. It is a good guidepost on how far ahead you need to be polling to be safe, but even stranger things can happen.
Average polling error is not true margin of error. These two may get conflated. Averages and ranges are different. Consider these three hypothetical distribution scenarios of twenty items, all of which have an average of 5.
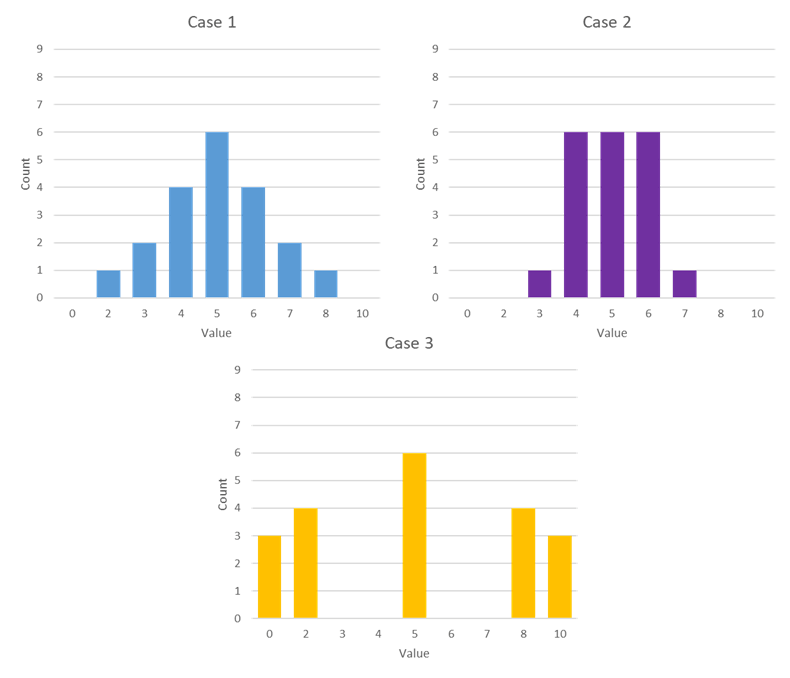
Case one: is somewhat normally distributed. Five is the most common value. We can expect the range to be from 2-8.
Case two: is distributed much more tightly. Same average as the other cases, but the most common (likely) value if pulled out of a hat could be 4, 5, or 6. Range is 3-7.
Case three: is a mess. Lots of extreme values, but it all averages out still to be 5. Range is 0-10.
All three have the same average, but the distribution makes the ranges vary. This idea often gets lost by news outlets in evaluating polls.
Let’s return to 2016, when the average error was 4.8%. New sources did not know this to be exact at the time. Even if they did, it is still possible for a state to veer beyond the average error. So for example maybe a state goes +6%, or even +7%, rather than the +4.8% that the average error tells us is to be expected. These cases are going to be rare, but not impossible. They become increasingly more rare as you venture further from the average. If you ever hear someone talk about a “distribution tail”, this is what they mean. Average polling error does not give you a clean, 100% range of outcomes, but generally is a good estimate.
Polling bias plays a factor as well.
Polls can also miss in one particular direction, rather than just bean equal spread. From FiveThirtyEight:
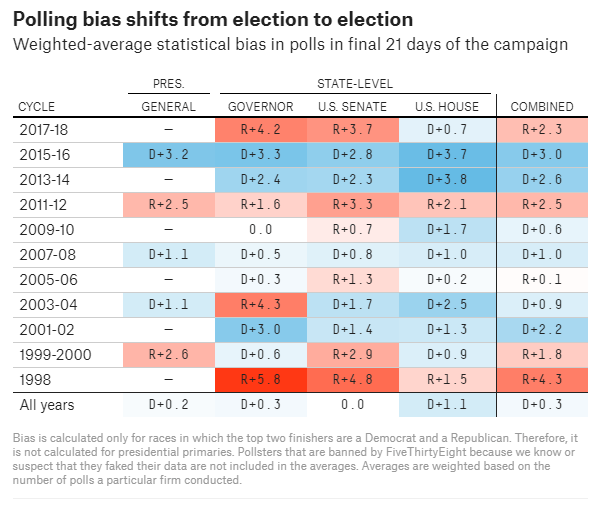
There is no question in 2016 that the polls were leaning toward Democrats. Interesting to note this is not always the case, Republicans had polling bias in the 2012 and 2000 presidential elections.
What next?
Most models I have looked into so far all acknowledge a lot of these errors and are being vigilant about them in their 2020 models. Take The New York Times for example:

It was not so much that the polls were so “wrong” in 2016, it is that we trusted them at face value and didn’t account for enough cushion. I aim to fix that in my model.
MY MODEL
I have rudimentary skills in Python (computer programming language) and a long standing interest in statistics and probability. That’s about where my resume ends. I knew I was not going to be able to build an incredibly complex model to take on the Economist or FiveThirtyEight. So I thought about how I could simplify a simulation down to be within my wheelhouse, but still let me build in the guardrails I want.
What I will share today is actually not my first election model. I starting thinking about this idea back in February and built a clunky, over-complicated model. With no democratic nominee yet chosen, I couldn’t use polling data to feed the model. Instead I relied on historical changes in voting margin from the 2004 – 2016 elections. I built out a probability model from this historic distribution, trying to use patterns from the past to predict the future.
The issue? 2020 is so ridiculous that we cannot simply pretend it will be anything like the past four elections. Trump is…Trump. COVID-19 has ravaged the world in ways we never thought possible. Voter participation is already expected to be much higher than any of the past four elections (which is usually assumed to be 55% of eligible US voters). We have stubborn partisan division in the country.
This model was trashed. From the ashes rose a simpler, more applicable one.
Methodology
I wanted to set some parameters and separate those states that safely belonged to one party versus potential swing states. I also wanted to make the boundaries between states crystal clear. Other models use various distinctions like “Safely Democratic, Likely Democratic, Leaning Democratic, Swing, Leaning Republican, Likely Republic, Safely Republican” all with different polling cutoffs. Few models agree where these cutoffs are. Advanced models too will project certain odds based on these categories or polling margins.
Take Florida for example. FiveThirtyEight has this contested swing state at 50.7% Biden, 48.6% Trump. This puts the state at -2.1%. Given that spread, they have Biden projected to win the state 66/100 simulations. Montana on the other hand is at +7.2%, putting Trump at a projected win in 85/100 simulations.
I could’ve put together a weighted chance simulation, but I think it doubles down on accepting the current input data as gospel. I want my model to be as disconnected from previous assumptions as much as possible. I want my model to be pessimistic.
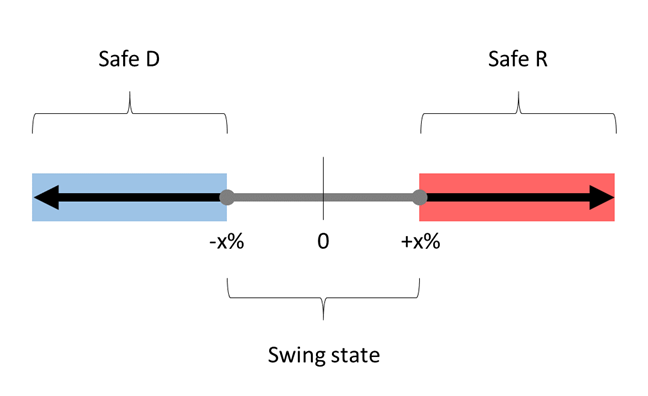
I decided I would tinker around with this cutoff point in various simulations. We will break all the states into three categories – Safe D (100% chance D wins, Safe R (100% chance R wins), and Swing (coin flip between candidates). We will let x% be our cutoff point.
Once we have the states in these categories, we will simulate the coin flip for each swing state. Safe states do not need to be simulated because we are assuming they have a 100% chance of falling to their respective party. We sum up the electoral votes for each candidate and decide a winner. Then we do it 9,999 times again.
Assumptions
Some states however, in my opinion, are “fake” swing states. I want to make sure they never get represented as such.
Texas and my home state of Georgia in particular are listed as swing states this year. Texas is at +1.9% and Georgia is shockingly at -0.9%. Texas last voted democratic as a state in 1976, Georgia in 1992. These are linchpin Republican states, and the fact they are even in play is a testament to Trump’s historically bad disapproval ratings. Since WW2 only two other presidents have had disapproval peaks higher (lower?) than Trump: Jimmy Carter and George H.W. Bush, both of whom ended up as single term presidents. Not a good sign for Trump. Moreover, they only had short peaks that surpassed Trump’s disapproval, mostly staying well below his average for most of their terms.
Before liberals get too excited that Georgia and Texas may “turn blue”, I personally do not think it is going to happen. Georgia and Texas both have long histories of voter suppression and purging, which continues to inexplicably follow their current governors throughout their entire careers.
Georgia’s Governor Brian Kemp is a first ballot Hall-of-Famer for voter suppression. Look no further than his governor run of 2018. Due to his previous position in the Georgia state government before running for governor, he was actually in charge of coordinating the election that he was running for, and refused to step down. Why is there no law to forbid this, I don’t know. As part of his “oversight”, he successfully purged 1.5 M voters from the rolls and helped facilitate the shutdown of 200+ polling sites, the majority of which were in minority and impoverished areas.
Texas’ Gregg Abbott is more of an all-star vote purger than a Hall-of-Famer, but time will tell if he is allowed to do enough damage to cement his legacy as one of the greatest to play the game. In 2019 it became clear that Abbott was behind a Texas initiative to purge voter rolls of 100,000 suspected non-citizens. Except that somehow they used incorrect data and accidentally purged tens of thousands of actual US citizens. Oops! There was a lawsuit, Abbott was ousted as the initiating party, he denied it, threw a few people under the bus, and that was about it. Texas has been busy this election, deciding that each county can only have one drop off box for mail-in ballots and GOP activists are currently in court trying to get 127,00 votes thrown out in a particularly heavy democratic county due to “disagreements” over drive-thru voting.
Since this is my model, I make the rules. Georgia and Texas are not swing states. They are safe republican states, no matter the polling.
My source code can be found here if anyone is interested. Please remember I am no coder and expect the way I went about writing the simulation was less than sexy. For those who are good at Python, I would love to hear your feedback on how I can improve my code and programming skills in general.
Results
I thought I would highlight three different cases and explain their results.
Case 1: 6% error on either side.
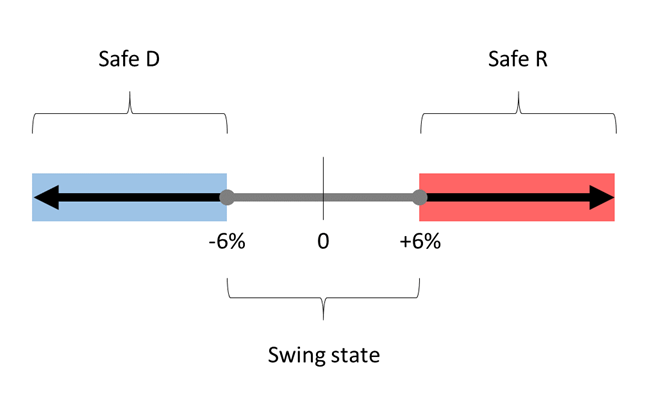
Six?? Five is a nice clean number, and is larger than the +/- 4.8% from 2016. The issue? At -5.1% Pennsylvania would be excluded from the simulation. Without Pennsylvania in play, Biden would have 100% chance of winning, meaning he has enough locked up votes that he could sacrifice every swing state and still win.
So, to make things interesting, we will assume a 6% error. At +/- 6% these are the following swing states (electoral votes in parentheses):
- Arizona (11)
- Florida (29)
- Iowa (6)
- Maine District 2 (1)
- Nebraska District 2 (1)
- North Carolina (15)
- Ohio (18)
- Pennsylvania (20)
Biden comes in with 258 votes, Trump at 179. Biden needs just 12 of the 101 swing electoral votes. Florida, North Carolina, Ohio, or Pennsylvania alone are enough to put him over. Even a combined Arizona and Maine or Nebraska district pulls Biden to victory. This is a very very bad situation for Trump to be in.
Simulation results ——–
- Biden’s odds: 9,646 / 10,000
- Trump’s odds: 308 / 10,000
- Tie: 46 / 10,000
This puts the simulation pretty close to the Economist’s projection.
Case 2: 10% error on either side.
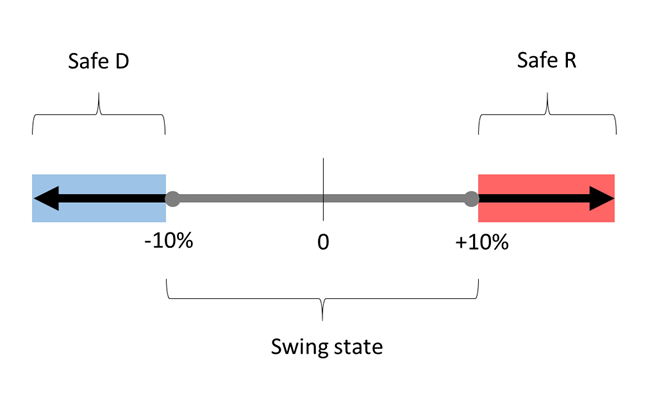
Let’s assume the polls are just atrocious this year. We are going with a 10% error. Tons of states are now at play!
Swing states (italics indicates a state that was not a swing in the 6% error simulation):
- Alaska (3)
- Arizona (11)
- Florida (29)
- Indiana (11)
- Iowa (6)
- Maine District 2 (1)
- Michigan (16)
- Minnesota (10)
- Missouri (10)
- Montana (3)
- Nebraska District 2 (1)
- Nevada (6)
- North Carolina (15)
- Ohio (18)
- Pennsylvania (20)
- South Carolina (9)
- Wisconsin (10)
Biden comes in with 216 votes, and Trump 143. Still a lot of ground for Trump to make up. You would think this scenario would help Trump a bit more, but he actually lost some medium states that otherwise would’ve been safe, such as Indiana and Missouri. Biden needs just 54 votes from the large list above.
Simulation results ——–
- Biden’s odds: 9,021 / 10,000
- Trump’s odds: 925 / 10,000
- Tie: 54 / 10,000
Now the simulation looks very close to that of FiveThiryEight.
Case 3 – Peter the Pessimist: 4% GOP boost with 5% error.
This is the ultimate “lessons learned from 2016” simulation. Let’s say that polling bias occurs in the same direction as before, in an even greater magnitude. In 2016 it was -3.2%. To combat this, we will apply +4% to every single state before we even consider the error. Then, we again surpass the 4.8% error of 2016 and instead use +/-5%. Keep in mind that this polling bias error was already built into the 4.8%, so we really are double dipping here and making this an extra cautious estimate.
The distribution will look like this:
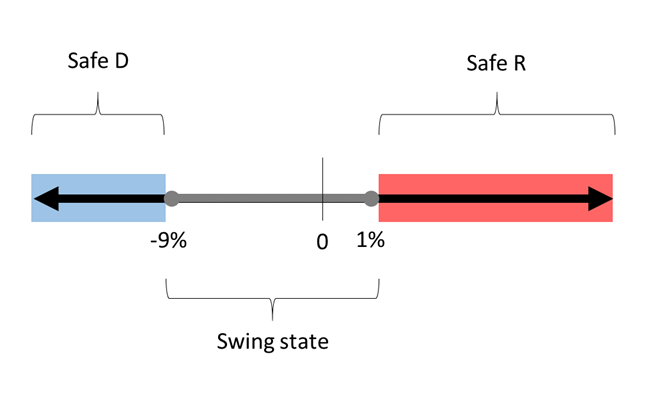
Swing states:
- Arizona (11)
- Florida (29)
- Maine District 2 (1)
- Michigan (16)
- Minnesota (10)
- Nebraska District 2 (1)
- Nevada (6)
- North Carolina (15)
- Ohio (18)
- Pennsylvania (20)
- Wisconsin (10)
Biden comes in with 216 votes like last simulation, but Trump closes the gap and has 185. Biden still needs 54 to win, Trump needs 85. Trump’s best chance is to pick up both Florida and Pennsylvania. Technically both could fall to Biden and Trump would still be alive, but he would basically need to run the table on nearly every other state.
Simulation results ——–
- Biden’s odds: 7,159 / 10,000
- Trump’s odds: 2,728 / 10,000
- Tie: 113 / 10,000
In my conservative estimate, Biden still is looking good.
CONCLUSION
In the three simulations, Biden wins 96%, 90%, and 72%.
If ballots are cast even remotely like the polls suggest, Trump really does have a very challenging road to victory. Is his house of cards ready to fall? Will the next season of The Apprentice The Presidency be renewed?
If you haven’t already, please go vote this Tuesday.
Thank you for reading,
Peter

1 Comment