
I admit that I am a strange sports fan. In fact, I am not sure I would really consider myself a “fan”.
I’ve mostly stopped watching sports all together. This year I watched one football game, the Super Bowl, and so far have not viewed a single NBA or college basketball game. I loosely follow the plight of the Mets but generally only attend one or two games a year.
My favorite way to consume sports is through statistics. I have made it a hobby over the years of trying to make more sense of what is going on in sports via calculator than what my friends can deduce using their eyes and hearts. I’m doing alright.
The best example is when I built a machine learning model to predict the over/under outcome of NBA games that could reach accuracies of ~55%. I would caveat that while this surely beats the average sports fan, it is likely not stable enough as a sole strategy to consistently beat Vegas. For full methodology, results, and discussion, feel free to read my report. (Shoutout to Prof. Karl for supporting me in this work).
Or consider that I had the most fantasy football wins in my 12 person league over a five year period, while not even remotely following football. I even won a championship! I think this speaks more to my hypothesis that fantasy football is primarily a lottery which requires minimal skill and that the best strategy is to be stable, level-headed, and go for standard value in drafting and constructing a team. Being boring is probably your best bet. I will admit however that this past year was a complete disaster for me, but I chalk that up to the randomness of injuries.
In essence, I greatly enjoy the uncertainty and randomness that surrounds sports. Which brings us to March Madness. I wrote a piece five years ago on this blog about it and thought I would revisit it, this time with a statistical lens.
The core of my interest comes from what I was hearing last season about the tournament being “crazier” and more volatile than years past. Consider this headline:
The most extreme March Madness upsets are happening more often. Why?
No. 15 and No 16 seeds are winning in the NCAA tournament more than ever before and by some distance. Is it a statistical anomaly or the outcome of a broader trend?
The article goes on to do no type of statistical review. Shame on them! Time for a mini project…
Problem
There are two things we want to consider here:
- Occurrence – Are there more upsets occurring now than in the past?
- Severity – Are lower seeds winning at a higher rate than they used to?
Approach
To do this I needed to mine a lot of data from all the previous tournaments since 1985, when it was expanded to the current 64 team format. I was not about to go manually do this. Fortunately Sports Reference came to the rescue (as always) and I was able to put together a Python script that scrapes each year’s tournament and records the seed winners. From there it was easy to parse out winners, upsets, and do some analysis.
It took me a few hours to write the script and then not even 30 seconds to run and analyze all 38 years of tournaments. Bless Python.
Results
Occurrence
To evaluate this, I looked at the number of upsets that occur in each tournament to determine if there is a trend. I count this simply as a lower seed beating a higher seed. Due to variability, it is better to look at the three year rolling average to try and smooth out any randomness. The results are graphed below – and are mostly boring. It seems the count of upsets could be elevated a bit (the last decade or so has shown a lot of years with 20 upsets) but are not at historic highs.
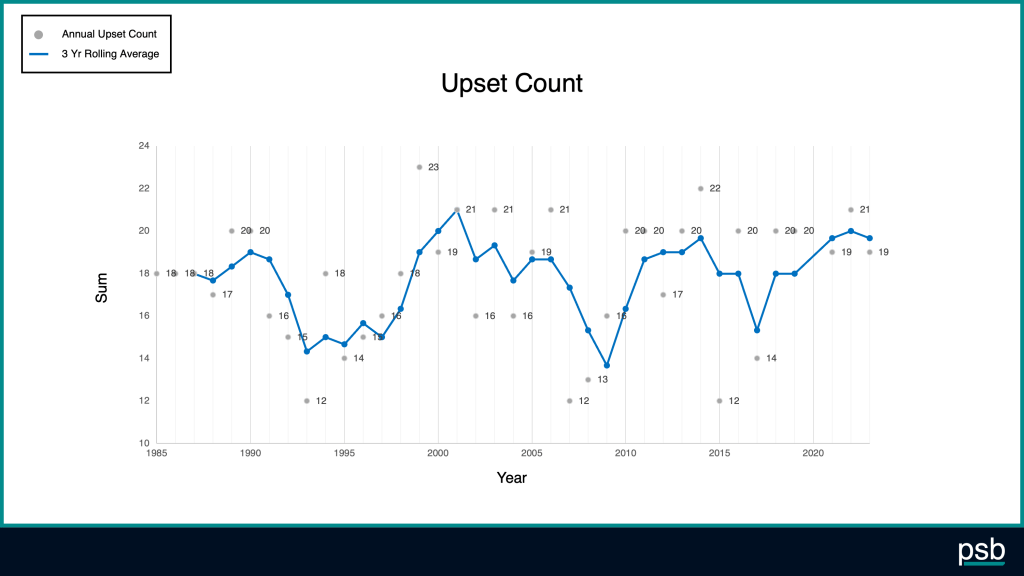
So in general, not too much to get excited about here.
Severity
Answering the severity question may be closer to the premise the article poses, are bigger upsets occurring?
To evaluate this I summed the total seed differential in wins observed over a tournament. So if a 7 beats a 3, thats 4 seed points. If a 15 upsets a 2, that’s 13. This gives a lot more credit to big wins than small ones. If I sum this up over the course of a tournament I can get a rough estimate of how “crazy” it was.
When we plot the annual seed differential and include a three year rolling average, we immediately see how high scoring recent tournaments have been, particularly since 2012. I plotted out a previous three year maximum line of 94 (which occurred in 1984 and then almost again in 2001), but since 2012 has been met or surpassed 6 times in 11 tournaments. Note there was no 2020 tournament because of COVID. The 2021 and 2022 tournaments in particular have been the highest scoring two years on record. Last year was not historically high, but was still above the 94 threshold.

Could the few 15 or 16 seed wins be inflating the overall stats?
Good question, I worried about this. However when you look at a round by round trend you see that the past decade has been elevated in seed sum in all rounds, and exceptionally high in the Sweet 16 round. This would suggest that even if there are more uncommon 16-1 and 15-2 upsets in the first round, large upsets are carrying forward into later rounds as well.

Even if you were to assume one big upset per year was a fluke and did not count it, 2021 and 2022 would both still be top 6 years all time out of 38 tournaments. Something meaningful is afoot here.
Why?
I don’t know for sure. This is hard to answer mathematically and is a good example of where my approach to sports starts to break down. This is back to the realm of the heavily involved fan / sports historian!
From my understanding of college basketball strategy and some quick research I continue to see a recurring theme – age of players. In general you want your players to be as experienced as possible when it comes to the tournament, so the more 22 and 23 year olds you can pack on your roster, the better. There are probably two layers to this particularly in the past few years: 1) the transfer portal and 2) the extra year of eligibility.
1) Transfer portal: It is easier for players to transfer between teams during the offseason and such transfers are at an all time high. Coaches would rather put older players on the roster than develop freshman. This new structure took place effective 2018.
2) Extra year of eligibility: Historically players were given five calendar years to play four seasons. There could be various reasons a player may miss a season and so this could keep them playing until 23 years old. Because of COVID the NCAA gave affected athletes and extension to six years to play four seasons, and season waivers were given. So it’s possible there are more older players in rotation than pre-COVID as well. This combined with the transfer portal may be the culprit behind the historic highs of 2021 and 2022.
What about NIL (name, image, and likeness)?
It’s hard to say if NIL has boosted the performance of lower seeded teams, especially so quickly. My guess is this is not quite at play yet, but will eventually drastically change the overall landscape of recruiting and team construction. Yet I am still not sold that it will be a big equalizer between teams and conferences.
Someone want to do more math for me?
It would be interesting to calculate an age metric for every team that has ever participated in the tournament and see if it is increasing, or if it correlates with higher upset likelihood. Given a blank slate I would sum up every career minute for all players on a given team that season and end up with some aggregated “experience” metric that might be useful. You could then even do some weighting of “tournament minutes” – high quality minutes that were played in a previous March Madness or conference tournament. There likely is some predictive power there, but it seems like a lot of work to do. Anyone want to help spearhead this?
This is all wonderful, how does it help my bracket?
I see three levers here to pull: 1) choosing the right number of upsets to include, 2) how big your upsets should be, and 3) avoiding certain uncommon bracket matchups.
Choosing the right number of upsets
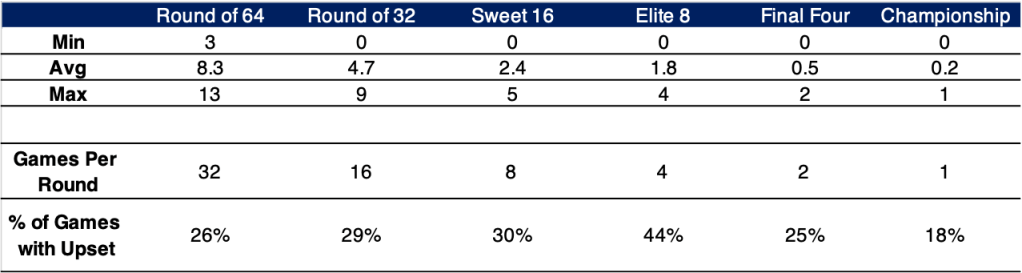
Here is a table that shows minimum, average, and max number of upsets that have occurred in each round over the 38 tournaments. Being close to the minimum or maximum may not be the wisest choices. Although if the scoring of your bracket significantly rewards upsets, I would consider making your choices to put you between the average and max per each round.
Size of upsets
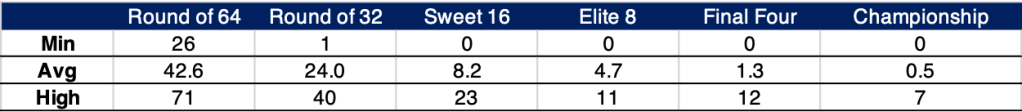
Note that this has changed a bit over the years, so here we will focus on 2012 and on. Similarly, you should sum up your seed differentials and see how they compare to the past 12 years.
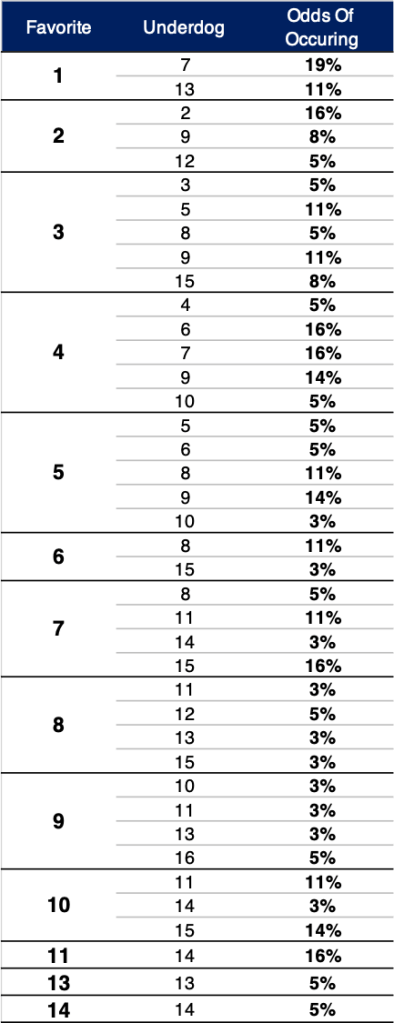
Another thing to consider are common upsets. Here I use the full dataset since 1985 as otherwise there might not be enough of a sample size. As is, I only included matchups with 10 or more occurrences to try and control for randomness. Still not as big of a sample as I would like for some of these.

Some juicy matchups pop out here. Eight seeds historically are favored to beat 4’s and 2’s? Six seeds fare quite well against 3 seeds. And 10 seeds sneakily pack some heat and win at a higher rate than one might assume.
Uncommon bracket matchups
By nature of how the tournament is seeded (1 vs 16, 2 vs 15, etc.) there are certain seed combinations that end up being very rare because of the chain of events that would be required to see these seeds meet. If you were to see any of these matchups in your bracket, maybe think twice about the selections you made previously. You might be barking up an improbable tree.
And with that I wish everyone luck this March Madness as you select your bracket. Even with some of the tips I laid out, you’re going to need it. It’s all bullshit anyways.
Cheers,
Peter

Perfectly timed email. I owe you a cut of any of my bracket winnings!!
LikeLike